


Kobashi et al 2011 was just published in GRL, and it looks like it will be upsetting the paleoclimate apple cart. The conclusions of Kaufman et al 2009 look to be minimized in comparison to this much more complete study. Questions over the split methodology for the last 60 years of data might be an issue, due to the change in methods of temperature reconstruction before and after the 1950 breakpoint. The amount of recent instrumental data is pretty low, and using it to calibrate the forward model might be a bit dodgy.
Abstract: Greenland recently incurred record high temperatures and ice loss by melting, adding to concerns that anthropogenic warming is impacting the Greenland ice sheet and in turn accelerating global sea‐level rise. Yet, it remains imprecisely known for Greenland how much warming is caused by increasing atmospheric greenhouse gases versus natural variability. To address this need, we reconstruct Greenland surface snow temperature variability over the past 4000 years at the GISP2 site (near the Summit of the Greenland ice sheet; hereafter referred to as Greenland temperature) with a new method that utilises argon and nitrogen isotopic ratios from occluded air bubbles.
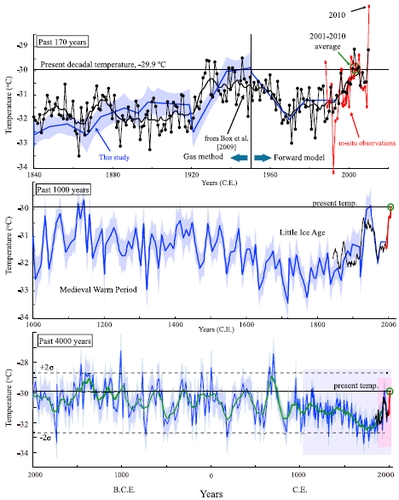
The estimated average Greenland snow temperature over the past 4000 years was −30.7°C with a standard deviation of 1.0°C and exhibited a long‐term decrease of roughly 1.5°C, which is consistent with earlier studies. The current decadal average surface temperature (2001–2010) at the GISP2 site is −29.9°C. The record indicates that warmer temperatures were the norm in the earlier part of the past 4000 years, including century‐long intervals nearly 1°C warmer than the present decade (2001– 2010).
Therefore, we conclude that the current decadal mean temperature in Greenland has not exceeded the envelope of natural variability over the past 4000 years, a period that seems to include part of the Holocene Thermal Maximum. Notwithstanding this conclusion, climate models project that if anthropogenic greenhouse gas emissions continue, the Greenland temperature would exceed the natural variability of the past 4000 years sometime before the year 2100.
Present Temperature in the Context of the Past 4000 Years [15] The current decadal surface temperature at Summit (2001–2010) is calculated to be −29.9 ± 0.6°C from the inversion‐ adjusted AWS record (Figure 1), and is illustrated in the 4000 year context (Figure 1). The current decadal average surface temperature at the summit is as warm as in the 1930s–1940s (Figure 1, top), and there was another similarly warm period (−29.7 ± 0.6°C) in the 1140s (Figure 1, middle) (Medieval Warm Period), indicating that the present decade is not outside the envelope of variability of the last 1000 years. Excluding the last millennium, there were72 decades warmer than the present one, in which mean temperatures were 1.0 to 1.5°C warmer, especially in the earlier part of the past 4000 years [Dahl‐Jensen et al., 1998; Wanner et al., 2008]. During two intervals (∼1300 B.P. and ∼3360 B.P.) centennial average temperatures were nearly 1.0°C warmer (−28.9°C, the 97 percentile) than the present decade (Figure 1, bottom).
From the above observations, we conclude that the current decadal mean snow temperature in central Greenland has not exceeded the envelope of natural variability of the past 4000 years. [16] This conclusion differs somewhat from the result of a recent reconstruction of Arctic summer air temperature over the past 2000 years, which indicates that a long cooling trend over the last 2000 years ended with a pronounced warming during the twentieth century [Kaufman et al., 2009].
Possible reasons for the differences are numerous, and include at a minimum 1) our record is a mean‐annual temperature, not a summer temperature, and variability is minimal in summer but highest in winter [Box, 2002]; 2) differences between air and snow temperature may be influenced by changes in cloud cover and wind speed, which affect the strength of the near‐surface inversion; and 3) our site is not necessarily representative of the whole Arctic, and may respond in opposite ways to annular mode fluctuations.
Source : wattsupwiththat.com


